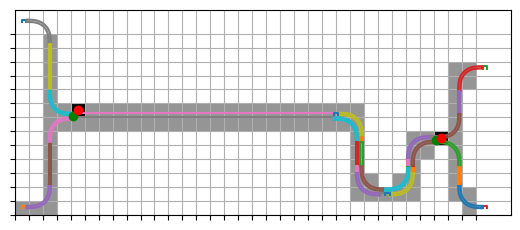
Discretization Example
from functools import partial
from types import SimpleNamespace
import gdsfactory as gf
from gdsfactory.gpdk import PDK
import doroutes as dr
PDK.activate()
import matplotlib.pyplot as plt
import numpy as np
import shapely.geometry as sg
from tqdm.notebook import tqdm
c = gf.Component()
ref = c << dr.pcells.fanout_frame2(
transition="ew",
add_frame=False,
num_inputs=2,
width=100,
)
c.add_ports(ref)
straight = "straight"
bend = {"component": "bend_euler", "settings": {"radius": 5}}
spacing = 1.0
_starts, _legs1 = dr.add_fan_in(
component=c,
inputs=[p for p in c.ports if str(p.name).startswith("in")],
straight=straight,
bend=bend,
spacing=spacing,
)
_stops, _legs2 = dr.add_fan_in(
component=c,
inputs=[p for p in c.ports if str(p.name).startswith("out")],
straight=straight,
bend=bend,
spacing=spacing,
)
if len(_starts) != len(_stops):
msg = "number of start ports is different than number of end ports"
raise ValueError(msg)
dr.routing.add_route_astar(
component=c,
start=(*np.mean(_starts, 0), "e"),
stop=(*np.mean(_stops, 0), "e"),
straight=partial(dr.pcells.straights, straight, len(_starts), spacing),
bend=partial(dr.pcells.bends, bend, straight, len(_starts), spacing),
layers=["WG"],
grid_unit=500,
)
c.show()
dr.util.show_cell(c)
API key for organization 'GDSFactory' found.
bbox = dr.util.as_kcell(c).bbox()
bbox = SimpleNamespace(
north=bbox.top, east=bbox.right, south=bbox.bottom, west=bbox.left
)
gu = 3000
start = (int(np.mean(_starts[:, 0])), int(np.mean(_starts[:, 1])), "e")
stop = (int(np.mean(_stops[:, 0])), int(np.mean(_stops[:, 1])), "e")
m = (bbox.east - bbox.west) // gu
n = (bbox.north - bbox.south) // gu
xc = np.arange(0, m) * gu + bbox.west
yc = np.arange(0, n) * gu + bbox.south
start_gu = (np.argmin(np.abs(xc - start[0])), np.argmin(np.abs(yc - start[1])))
stop_gu = (np.argmin(np.abs(xc - stop[0])), np.argmin(np.abs(yc - stop[1])))
_start = (start_gu[0] * gu + bbox.west, start_gu[1] * gu + bbox.south)
_stop = (stop_gu[0] * gu + bbox.west, stop_gu[1] * gu + bbox.south)
xb = np.arange(0, m + 1) * gu + bbox.west - gu / 2
yb = np.arange(0, n + 1) * gu + bbox.south - gu / 2
Y, X = np.meshgrid(yb, xb)
grid = np.zeros((m, n), dtype=int)
layer = dr.types.validate_layer(gf.kcl, "WG")
polys = dr.util.extract_polys(c, [layer])
mp = sg.MultiPolygon([sg.Polygon(p) for p in polys])
for i, x in enumerate(tqdm(xc)):
for j, y in enumerate(yc):
cell = sg.Polygon(
[
(x - gu / 2, y - gu / 2),
(x - gu / 2, y + gu / 2),
(x + gu / 2, y + gu / 2),
(x + gu / 2, y - gu / 2),
]
)
grid[i, j] = cell.intersects(mp)
grid[start_gu] = 2
grid[stop_gu] = 2
plt.pcolormesh(X, Y, grid, cmap="Greys")
for poly in polys:
plt.plot(*poly.T)
plt.plot(start[0], start[1], "o", color="green")
plt.plot(stop[0], stop[1], "o", color="green")
plt.plot(_start[0], _start[1], "o", color="red")
plt.plot(_stop[0], _stop[1], "o", color="red")
plt.xticks(xb, ["" for _ in xb])
plt.yticks(yb, ["" for _ in yb])
plt.grid(visible=True)
plt.axis("scaled")
plt.show()
0%| | 0/33 [00:00<?, ?it/s]